Statistical and financial
These series summarise many values at once: the spread of a measurement, a grid of intensities, or a day of trading.
Boxplot
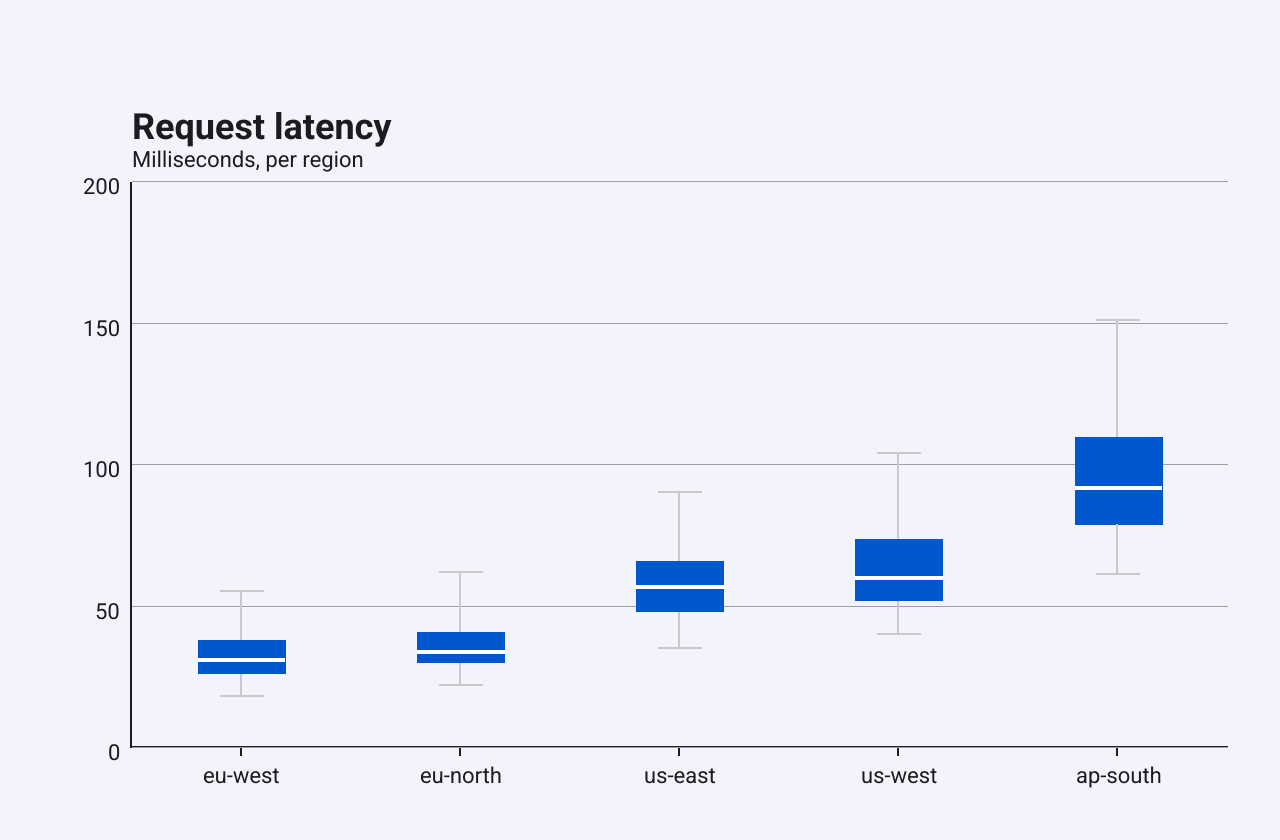
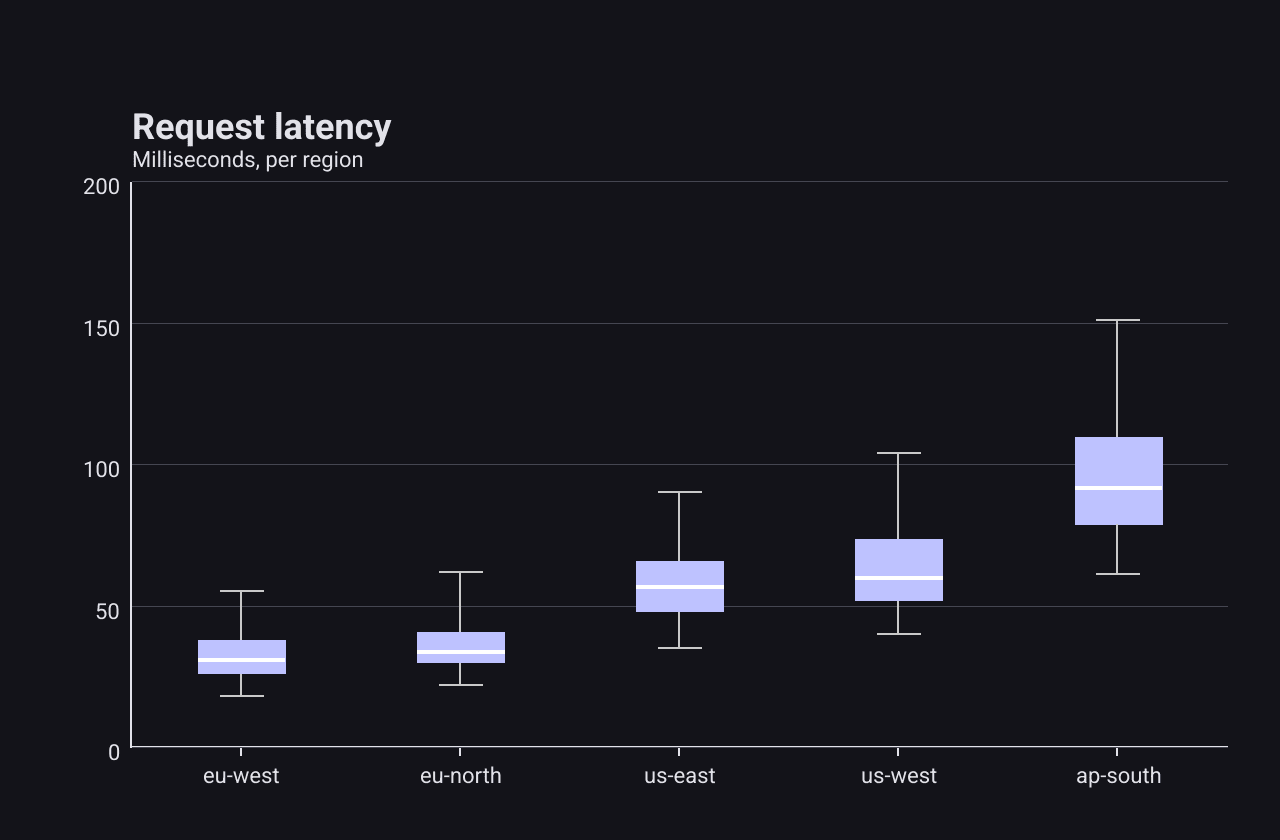
A BoxplotSeries
draws one box and whisker per category. Use it to compare the spread of a
measurement between groups, such as latency per region.
c := chart.New(chart.Option{
	Title: &chart.Title{Text: "Request latency", SubText: "Milliseconds, per region"},
	XAxis: []axis.Config{{Type: axis.TypeCategory, Data: []string{"eu-west", "eu-north", "us-east", "us-west", "ap-south"}}},
	YAxis: []axis.Config{{Type: axis.TypeValue}},
	Series: []series.Series{
		&series.BoxplotSeries{
			SeriesName: "Latency",
			BoxWidth:   0.4,
			Data: []series.BoxplotData{
				{Min: 18, Q1: 26, Median: 31, Q3: 38, Max: 55},
				{Min: 22, Q1: 30, Median: 34, Q3: 41, Max: 62},
				{Min: 35, Q1: 48, Median: 57, Q3: 66, Max: 90},
				{Min: 40, Q1: 52, Median: 60, Q3: 74, Max: 104},
				{Min: 61, Q1: 79, Median: 92, Q3: 110, Max: 151},
			},
		},
	},
})
Each
BoxplotData
is a five-number summary: Min, Q1, Median, Q3 and Max. The series
does not compute it from raw samples, so you work out the quartiles yourself.
The box runs from Q1 to Q3 with a line at the median, and the whiskers
reach Min and Max.
BoxWidth is the box’s width as a fraction of the space per category
(default 0.5). Color sets the box colour. The median line is always white
and the whiskers always light grey.
Heatmap
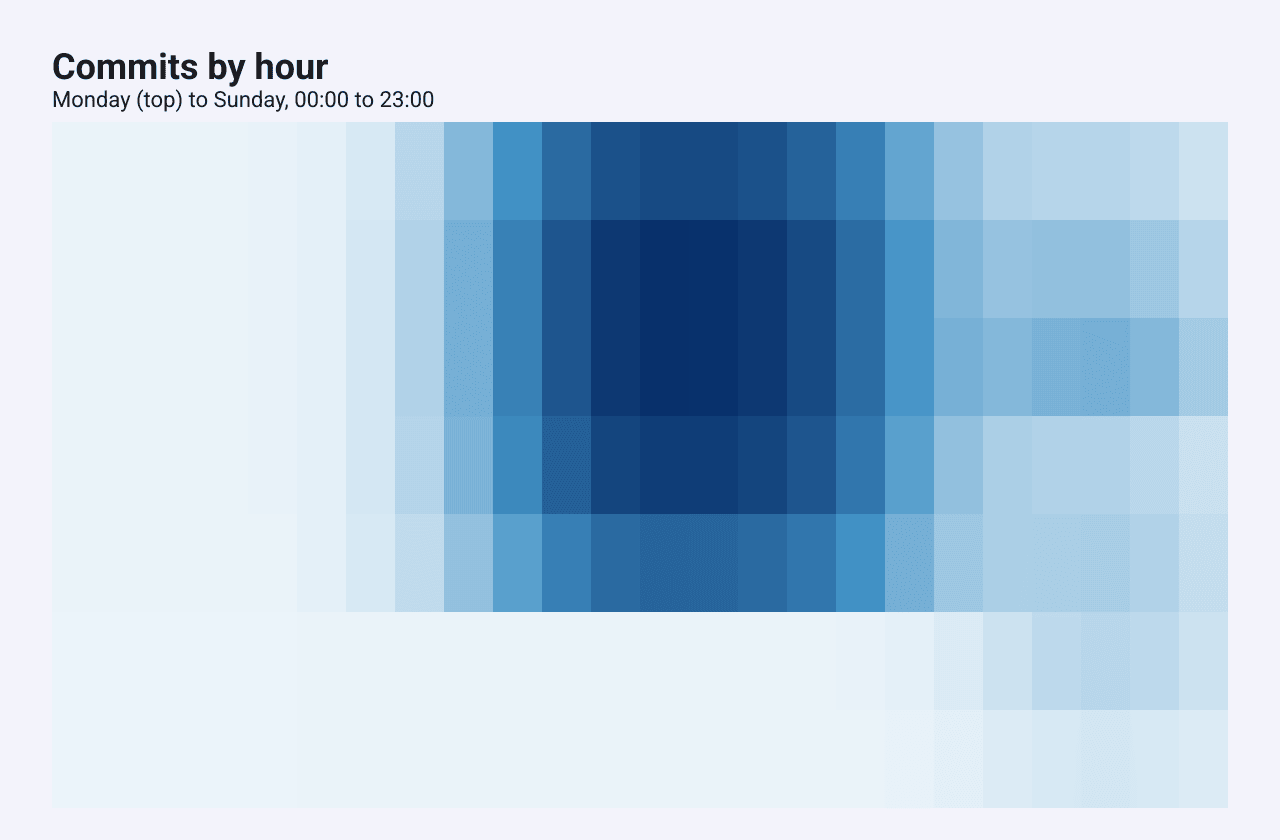
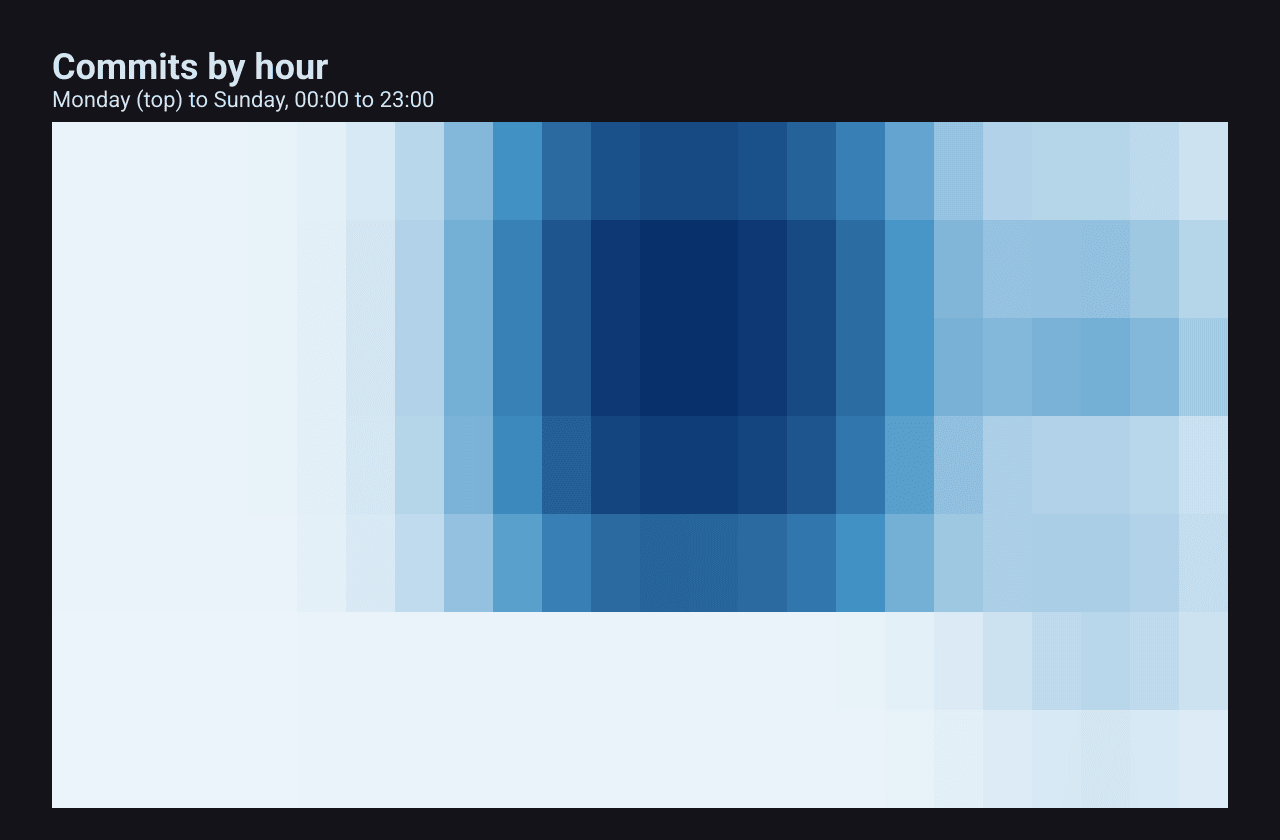
A HeatmapSeries
colours each cell of a grid by its value. Use it for values that depend on two
categories at once, such as activity by weekday and hour.
c := chart.New(chart.Option{
	Title: &chart.Title{Text: "Commits by hour", SubText: "Monday (top) to Sunday, 00:00 to 23:00"},
	Series: []series.Series{
		&series.HeatmapSeries{
			SeriesName: "Commits",
			Rows:       rows,
			Cols:       cols,
			Data:       data, // row-major: Data[row*Cols+col]
			XLabels:    hours,
			YLabels:    []string{"Mon", "Tue", "Wed", "Thu", "Fri", "Sat", "Sun"},
			ColorStops: []series.HeatmapColorStop{
				{Position: 0, Color: color.NRGBA{R: 235, G: 244, B: 250, A: 255}},
				{Position: 0.5, Color: color.NRGBA{R: 66, G: 146, B: 198, A: 255}},
				{Position: 1, Color: color.NRGBA{R: 8, G: 48, B: 107, A: 255}},
			},
		},
	},
})
The main fields:
RowsandColsgive the grid size, andDataholds the values row by row: the value for rowrand columncisData[r*Cols+c].Value(row, col)reads one back.MinandMaxset the range that the colours span. When both are zero they are taken from the data.ColorStopsis the colour scale: eachHeatmapColorStopmaps a position from 0 to 1 in that range to a colour, and colours in between are blended. Without stops the scale runs from deep blue through yellow to deep red.
The heatmap fills the whole plot area and draws no axes. XLabels and
YLabels name the columns and rows in the tooltip only; they are not drawn
next to the grid. Put the meaning of rows and columns in the title, as the
example does, or in labels of your own around the chart.
Candlestick
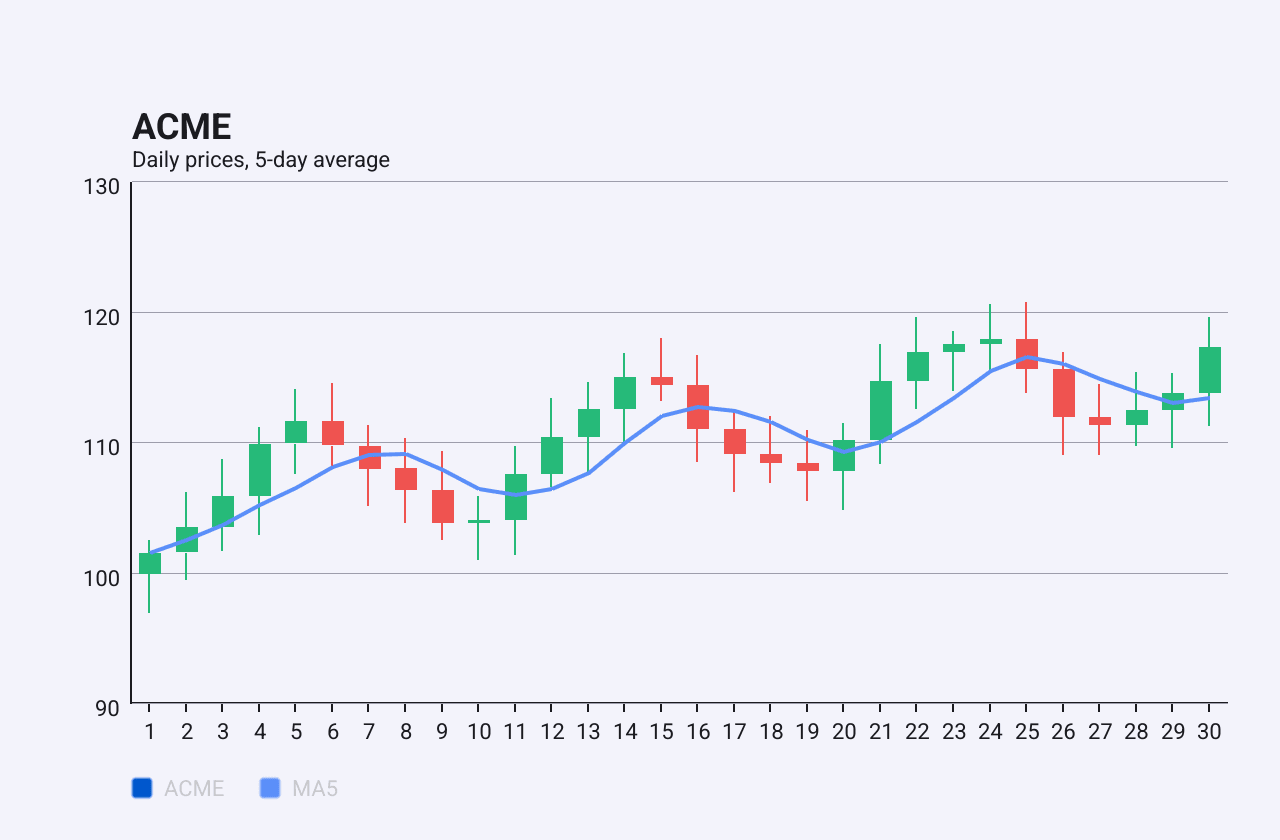
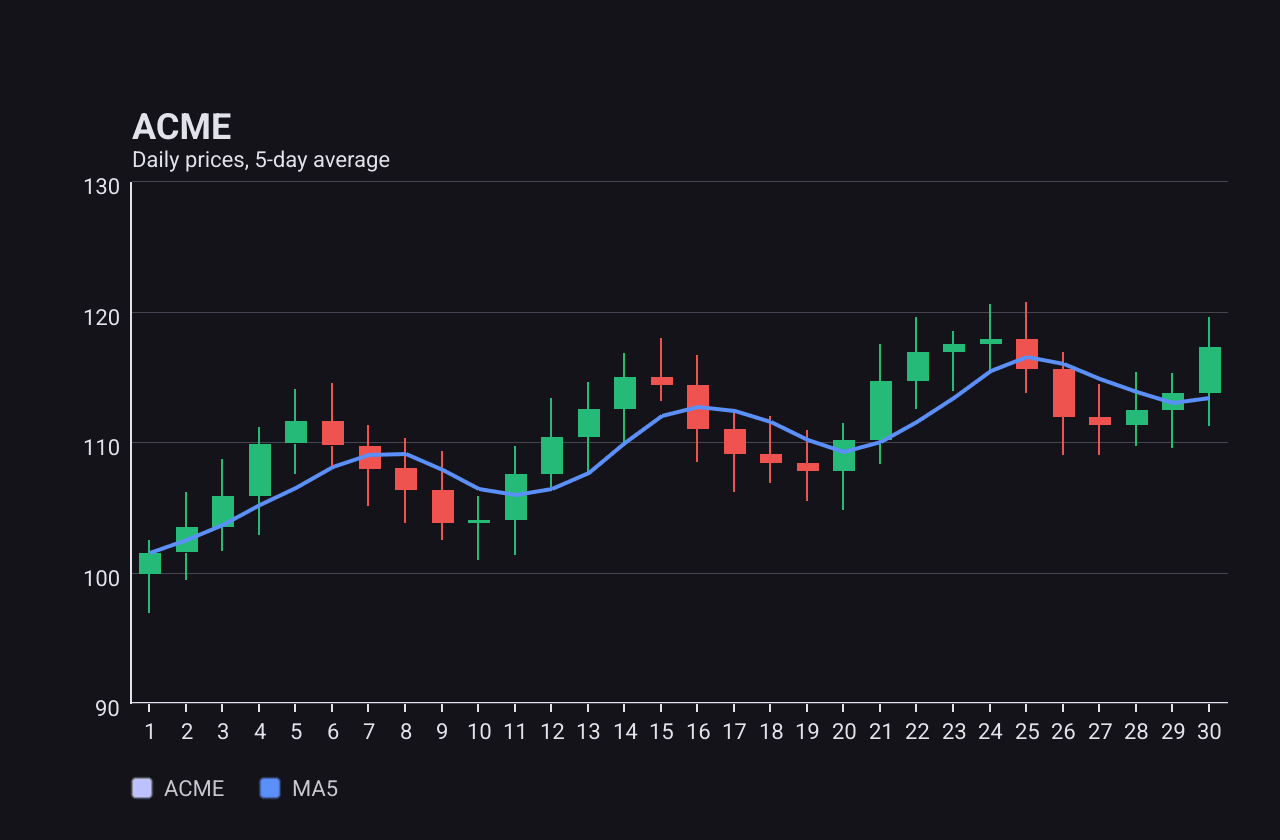
A CandlestickSeries
draws the open, high, low and close of each period. It is the standard view of
a price over time.
c := chart.New(chart.Option{
	Title: &chart.Title{Text: "ACME", SubText: "Daily prices, 5-day average"},
	XAxis: []axis.Config{{Type: axis.TypeCategory, Data: days}},
	YAxis: []axis.Config{{Type: axis.TypeValue}},
	Series: []series.Series{
		&series.CandlestickSeries{
			SeriesName: "ACME",
			Data:       candles, // one Open/High/Low/Close per category
			BarWidth:   0.6,
		},
		&series.LineSeries{SeriesName: "MA5", Data: avg},
	},
})
Each
CandlestickData
has Open, High, Low and Close, one per category. The body runs from
open to close and the wick from low to high. A candle whose close is at or
above its open uses UpColor (green by default); any other uses DownColor
(red by default). BarWidth is the body width as a fraction of the space per
category (default 0.6).
A candlestick series shares the axes with other cartesian series, so an
indicator such as a moving average is just a LineSeries in the same option.
To add candles as they arrive, call AppendCandles on the series or
AppendCandlestick on the chart (see Live data). To show
volume in a pane of its own under the prices, use a
chart group.