Maps
Four series work with geographic coordinates. A MapSeries draws a map from
image tiles. GeoScatterSeries and GeoLinesSeries draw points and routes on
top of it. A ChoroplethSeries colours regions read from GeoJSON, with or
without a tile map underneath.
On a chart with a map, drag to pan and scroll to zoom. Coordinates are always longitude first, then latitude, in degrees.
Map
A MapSeries
fills the plot area with a tiled web map.
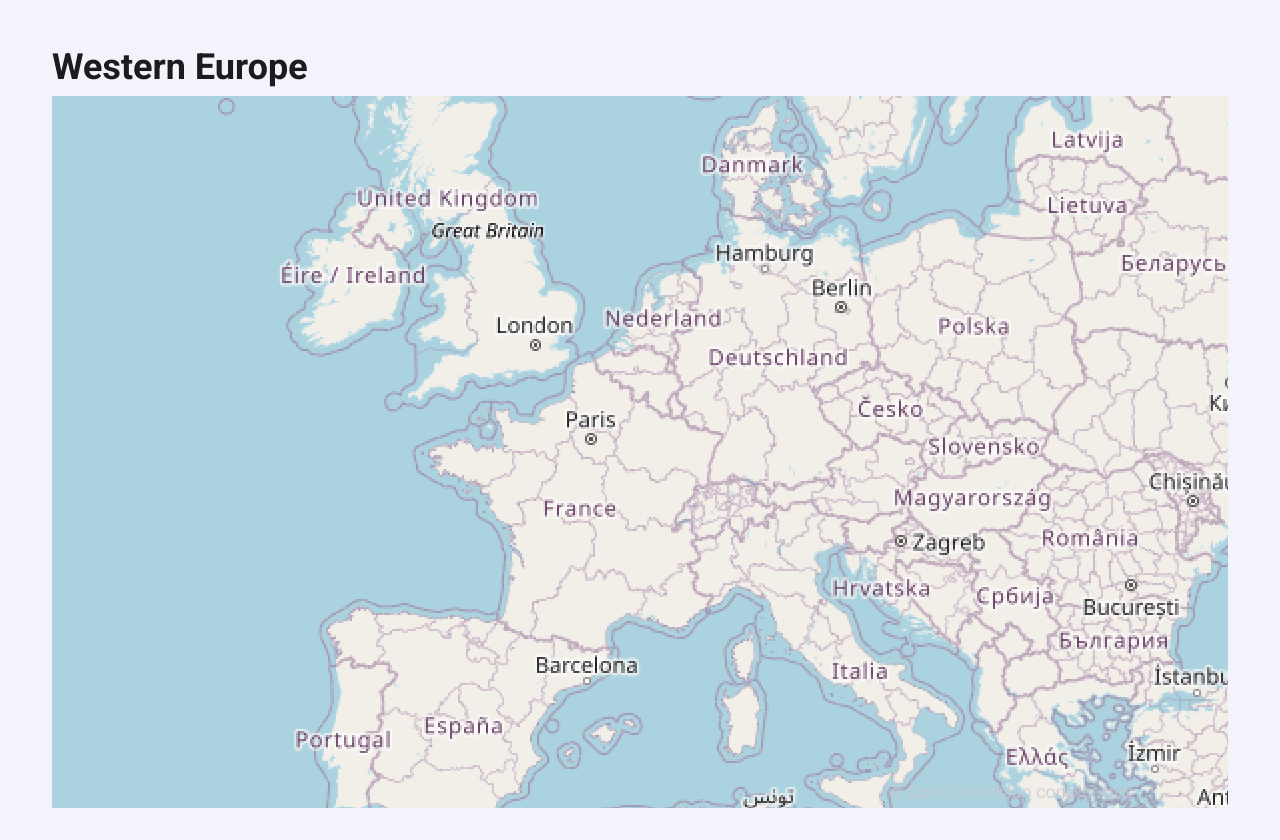
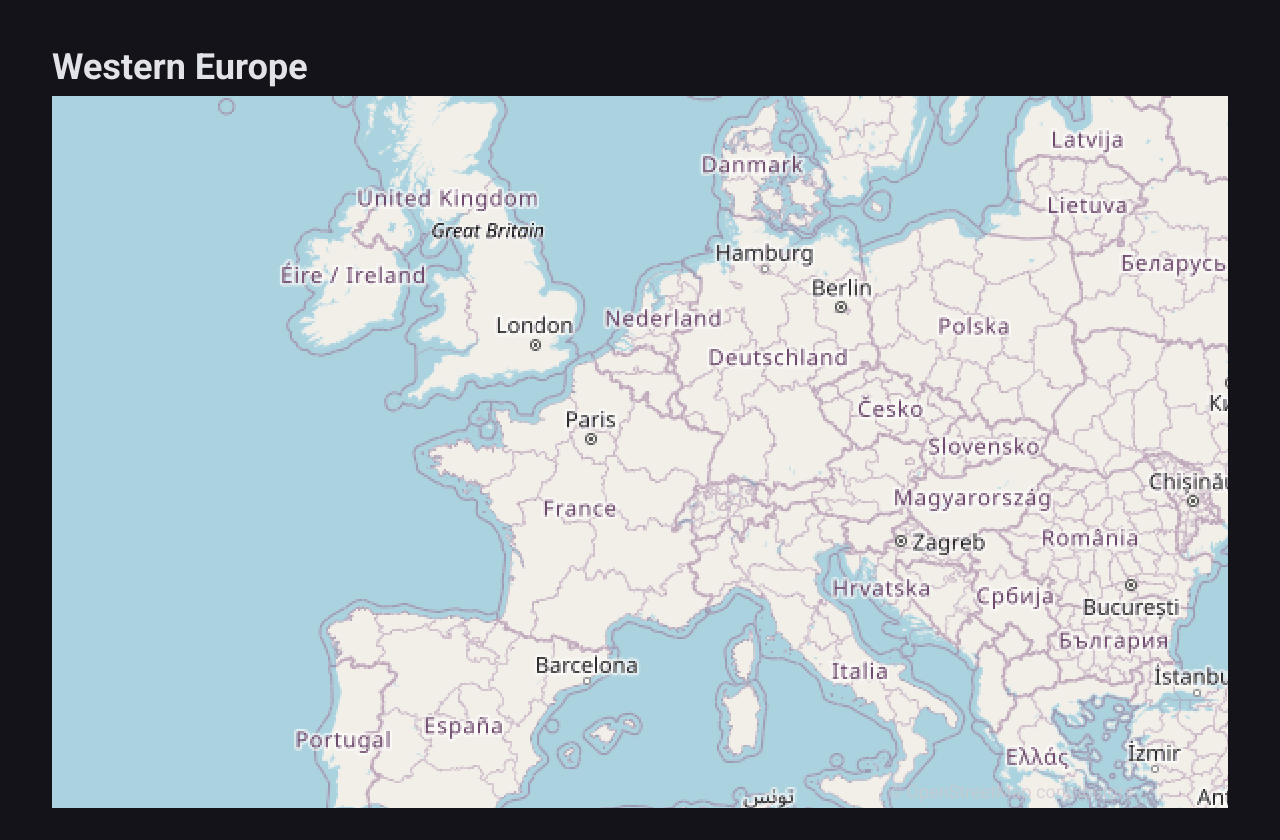
Map tiles in the screenshots on this page © OpenStreetMap contributors.
c := chart.New(chart.Option{
	Title: &chart.Title{Text: "Western Europe"},
	Series: []series.Series{
		&series.MapSeries{
			SeriesName: "Map",
			Center:     [2]float64{4.5, 48.5}, // longitude, latitude
			Zoom:       4,
			// TileURL: "https://tiles.example.com/{z}/{x}/{y}.png",
		},
	},
})
Center is the longitude and latitude in the middle of the view, and Zoom
the usual web-map zoom level, from 1 (the whole world) to 18 (a street).
Fractional zoom levels work. TileURL is a template with {z}, {x} and
{y} placeholders; when it is empty, tiles come from OpenStreetMap.
Tiles are downloaded in the background over the network and appear as they
arrive. Until then the map shows a plain sea colour. The map draws an
OpenStreetMap attribution in its corner, in a light grey that is hard to see
on light tiles. If you use OpenStreetMap’s tile servers, follow their
tile usage policy; an
app with many users should use a tile provider of its own through TileURL.
Geo scatter
A GeoScatterSeries
draws a dot at each place.
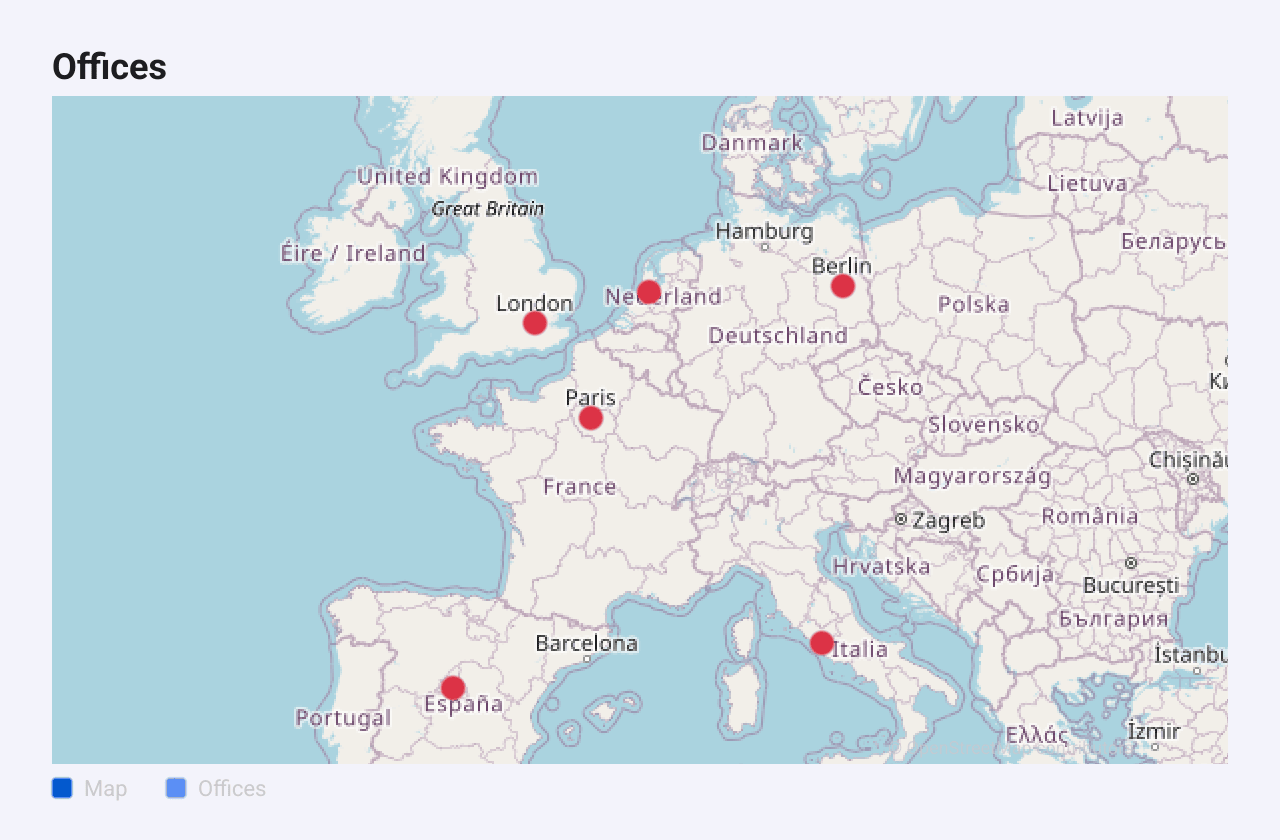
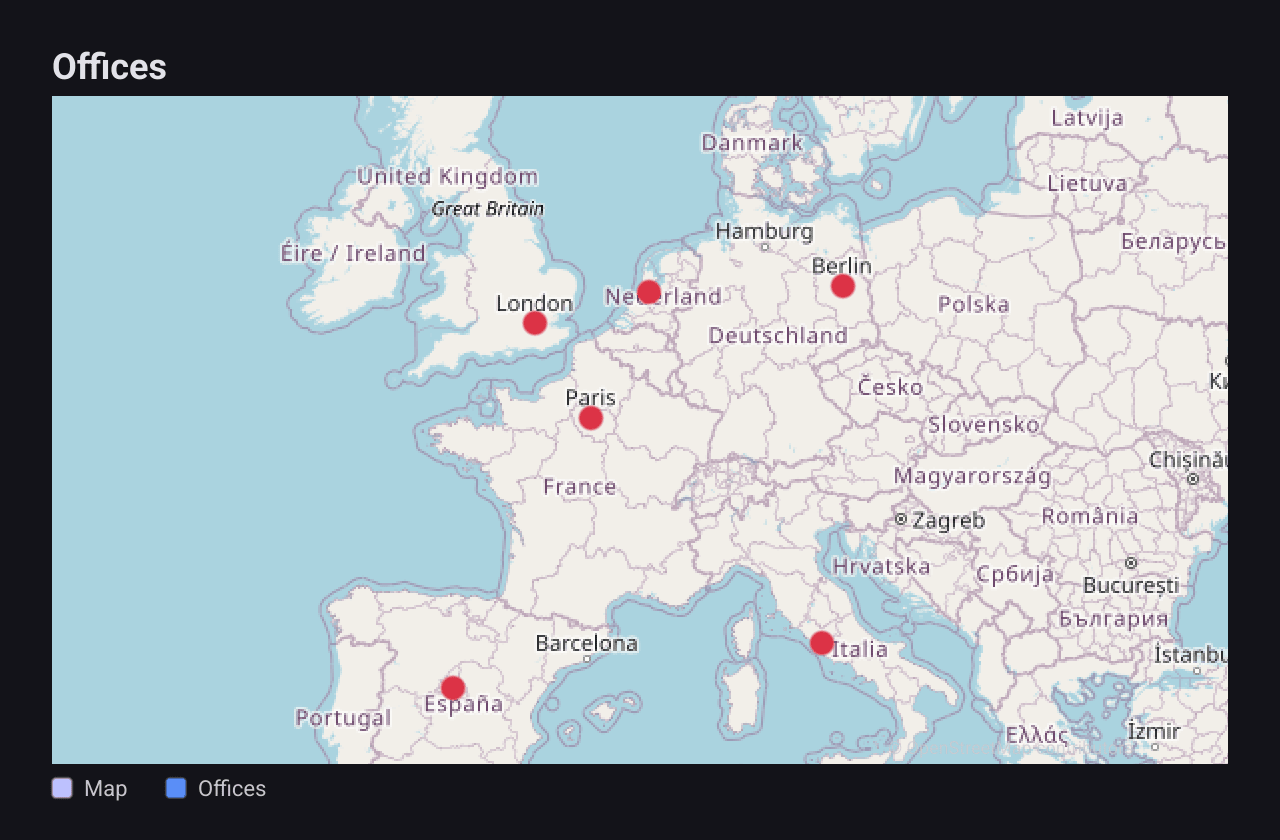
center := [2]float64{4.5, 48.5}
zoom := float32(4)
c := chart.New(chart.Option{
	Title: &chart.Title{Text: "Offices"},
	Series: []series.Series{
		&series.MapSeries{SeriesName: "Map", Center: center, Zoom: zoom},
		&series.GeoScatterSeries{
			SeriesName: "Offices",
			MapCenter:  center, // match the MapSeries
			MapZoom:    zoom,
			Data: []float64{ // lon0, lat0, lon1, lat1, ...
				-0.13, 51.51, // London
				2.35, 48.86, // Paris
				4.90, 52.37, // Amsterdam
				13.40, 52.52, // Berlin
				-3.70, 40.42, // Madrid
				12.50, 41.90, // Rome
			},
			SymbolSize: 12,
			Color:      color.NRGBA{R: 220, G: 50, B: 70, A: 255},
		},
	},
})
Data stores longitude, latitude pairs flat: [lon0, lat0, lon1, lat1, ...].
SymbolSize sets the dot size (default 6) and Color its colour. Dots are
always circles; Symbol has no effect in v1.0.0.
When the chart has a MapSeries, every geographic series uses the map’s
projection, so the points follow the map as the user pans and zooms. Set
MapCenter and MapZoom to the map’s values anyway: a series uses them on
its own when there is no map.
Geo lines
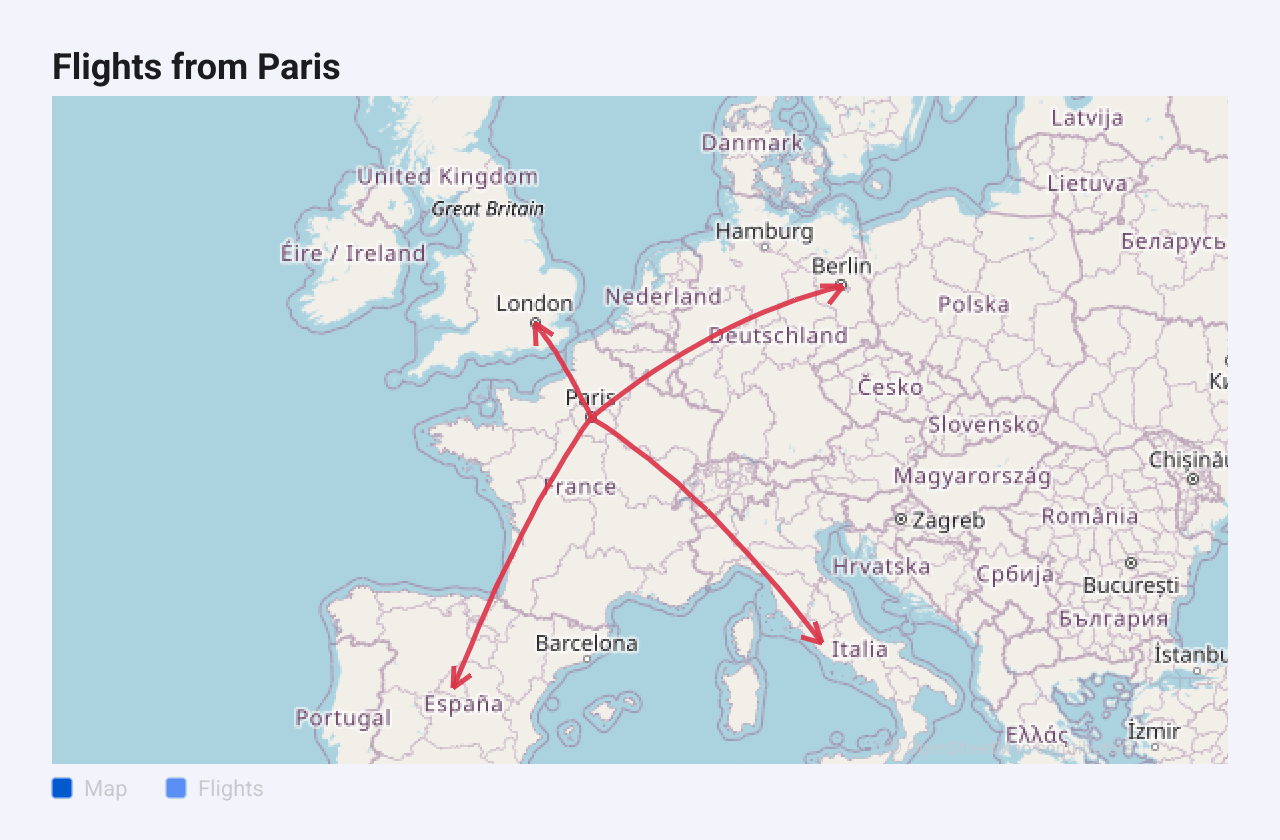
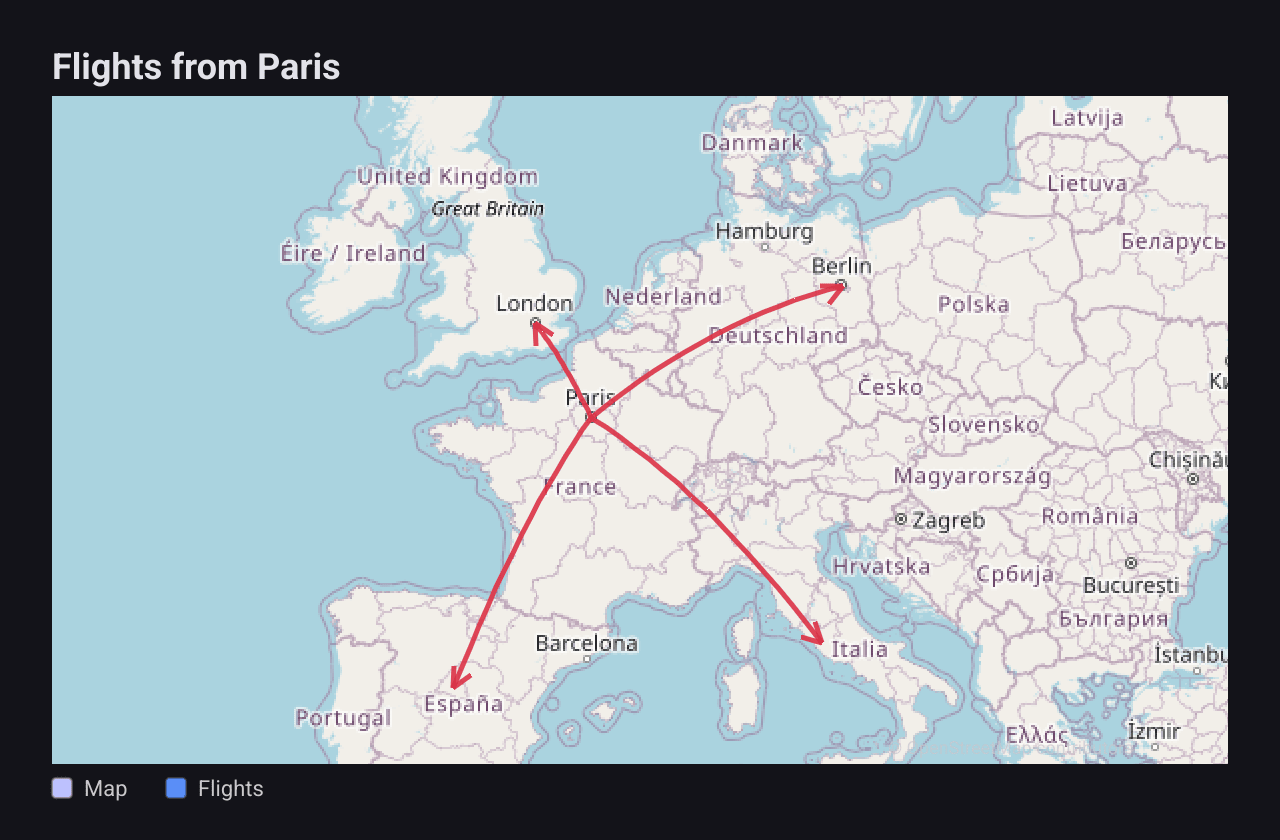
A GeoLinesSeries
draws a line from one place to another, with an arrowhead at the destination.
Use it for routes or flows between places.
center := [2]float64{4.5, 48.5}
zoom := float32(4)
c := chart.New(chart.Option{
	Title: &chart.Title{Text: "Flights from Paris"},
	Series: []series.Series{
		&series.MapSeries{SeriesName: "Map", Center: center, Zoom: zoom},
		&series.GeoLinesSeries{
			SeriesName: "Flights",
			MapCenter:  center,
			MapZoom:    zoom,
			Curved:     true,
			Width:      2.5,
			Color:      color.NRGBA{R: 220, G: 50, B: 70, A: 230},
			Data: []series.GeoLine{
				{From: [2]float64{2.35, 48.86}, To: [2]float64{-0.13, 51.51}}, // London
				{From: [2]float64{2.35, 48.86}, To: [2]float64{13.40, 52.52}}, // Berlin
				{From: [2]float64{2.35, 48.86}, To: [2]float64{-3.70, 40.42}}, // Madrid
				{From: [2]float64{2.35, 48.86}, To: [2]float64{12.50, 41.90}}, // Rome
			},
		},
	},
})
Each GeoLine
has From and To as longitude, latitude pairs. Curved bends the lines into
arcs, Width sets their thickness (default 2) and Color their colour.
GeoLine.Value is not used for drawing in v1.0.0.
Choropleth
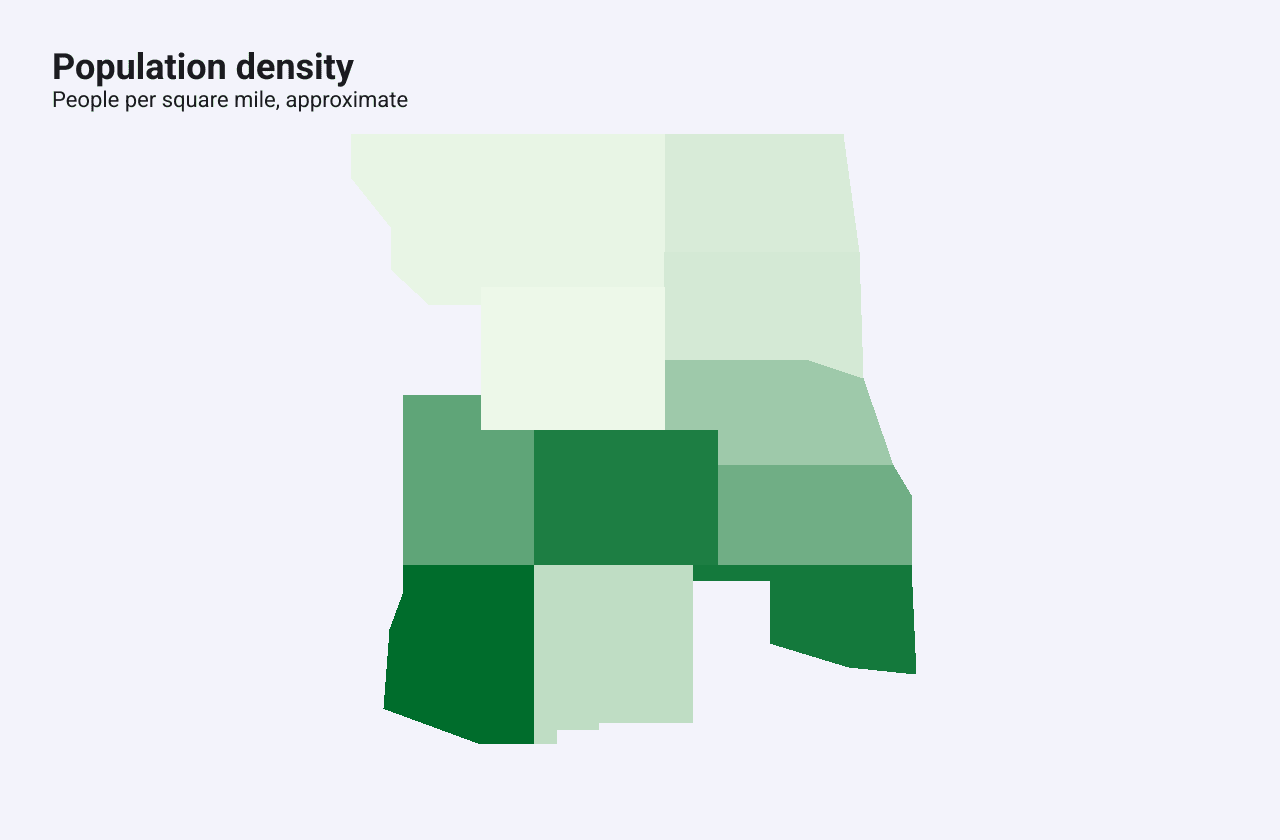
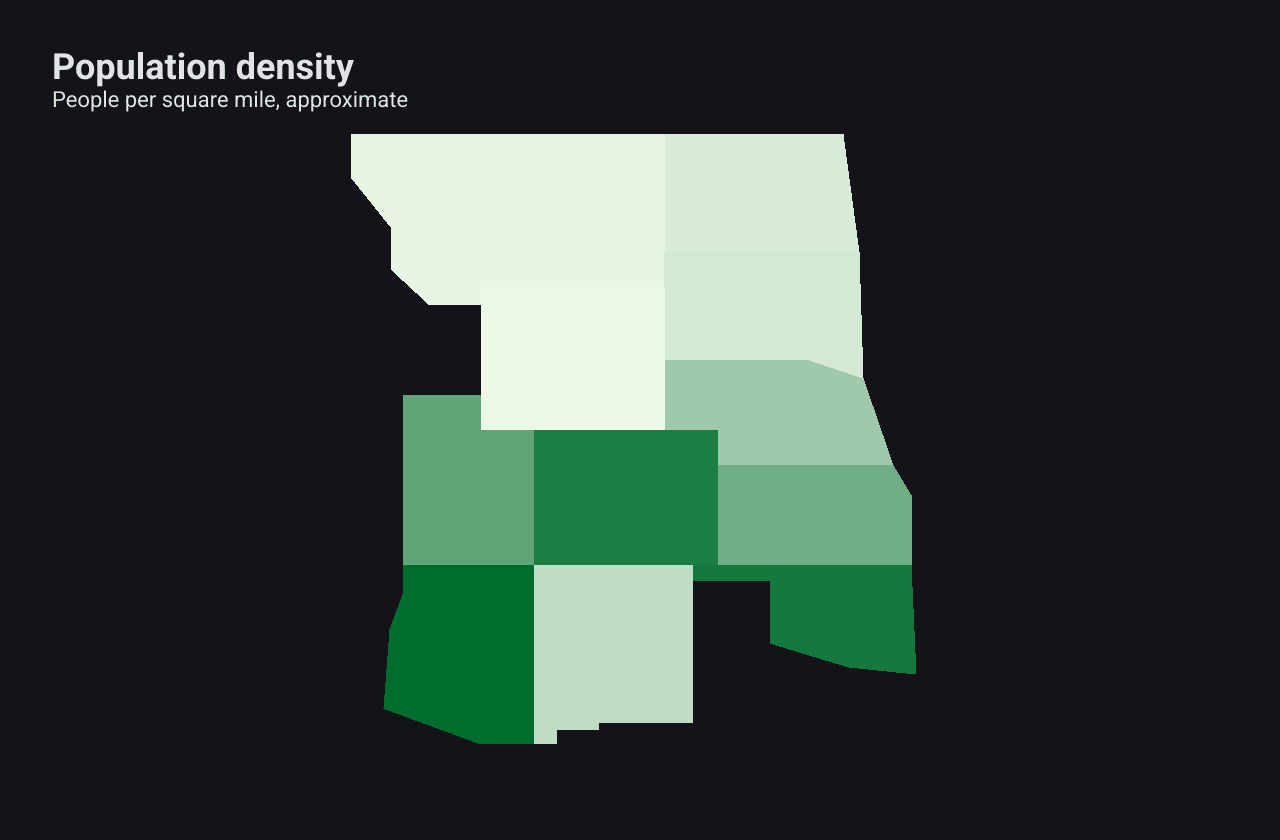
A ChoroplethSeries
fills regions, such as countries or states, with a colour for their value.
c := chart.New(chart.Option{
	Title: &chart.Title{Text: "Population density", SubText: "People per square mile, approximate"},
	Series: []series.Series{
		&series.ChoroplethSeries{
			SeriesName: "Density",
			GeoJSON:    featureCollection(), // or GeoJSONURL to download it
			MapCenter:  [2]float64{-105, 40},
			MapZoom:    4.2,
			RegionData: map[string]float64{
				"Montana": 7, "Wyoming": 6, "Colorado": 56, "Utah": 40,
				"Arizona": 63, "New Mexico": 17, "North Dakota": 11,
				"South Dakota": 12, "Nebraska": 25, "Kansas": 36, "Oklahoma": 58,
			},
			ColorStops: []series.HeatmapColorStop{
				{Position: 0, Color: color.NRGBA{R: 237, G: 248, B: 233, A: 255}},
				{Position: 1, Color: color.NRGBA{R: 0, G: 109, B: 44, A: 255}},
			},
		},
	},
})
The regions come from a GeoJSON feature collection, either downloaded from
GeoJSONURL in the background or given inline in GeoJSON. The example builds
a small one in code from hand-simplified outlines, so it runs offline.
RegionData maps a region to its value. A feature is matched by its name,
read from the first of the properties name, NAME, admin, ADMIN,
name_en, NAME_EN, iso_a3 or ISO_A3 that it has, and otherwise by an
identifier such as iso_a3, iso_a2 or id. Regions with no value are drawn
in translucent grey. Min, Max and ColorStops work as in a
heatmap; the default scale runs from pale to dark green.
Set MapCenter and MapZoom to frame the regions, or add a MapSeries
first to draw them over a tile map. Regions are filled without outlines. In
v1.0.0 the choropleth shows tooltips only for a short built-in list of large
countries, looked up by name.